After reading this post (CLR 4.0 advancements in diagnostics) I was happy that now the CLR team is investing resources in better debugging of minidumps.
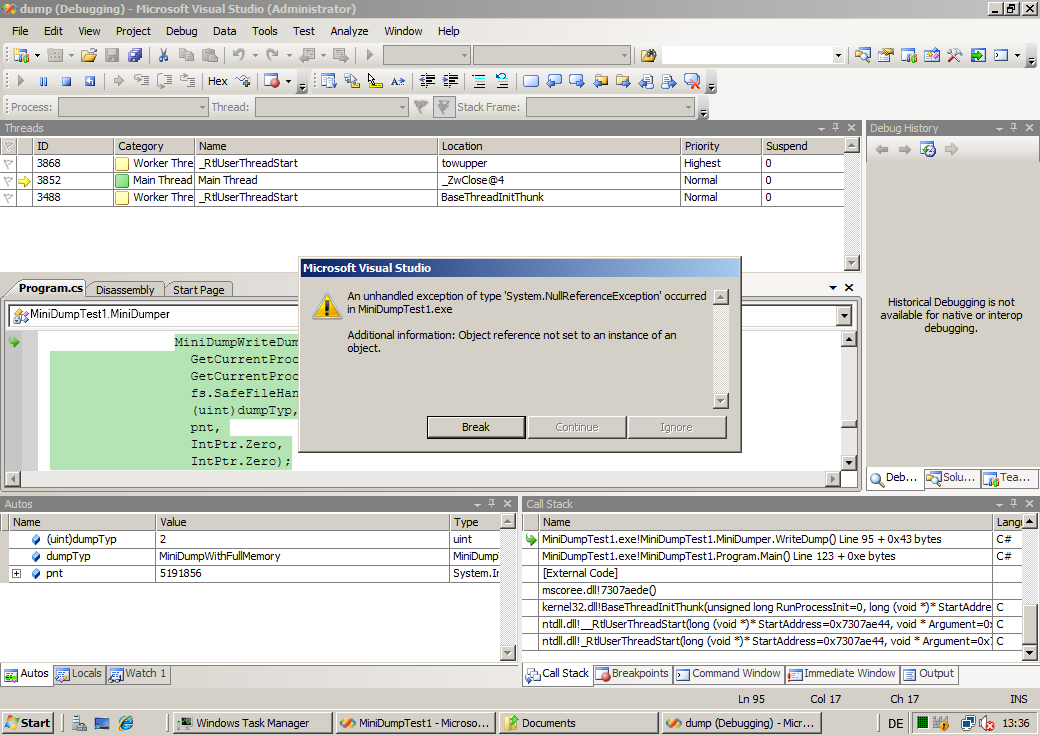
I made a small example in C#4 and wanted to try this new feature in the VS2010CTP version. You just need to double-click on the dmp-file. It will start VS2010CTP. Then you will need to “start debugging” (for example press F10), and then you will get the following result-screen:

So it seems that it works “mostly”. But the debugger seems to forget to switch to the exception callstack and instead displays the “minidump-writing callstack”. Hopefully this will be fixed in one of the next (beta) releases.
Here is the link to my connect-feedback: Debugging (managed) MiniDumps displays the writing-callstack and not the exception-callstack
Pingback: Jochen Kalmbach’s Blog » Blog Archive » Writing MiniDumps in C#